The film forming process of atomic layer deposition has excellent shape-preserving properties, but under the limit conditions, the deposition rate at the bottom of the hole will slow down, forming "poor deposition" that will affect the subsequent process steps. This model is used to simulate different substrate sizes and different reaction environments of pore structure and analyze the results, which provides help for parameter adjustment in practical application.
4.2.1. Effects of Radius and Aspect Ratio on Growth Rate
Condition 1: the basic conditions remain unchanged, the gas inlet time is 0.6s, the hole with a radius of 20nm, and the depth increases successively. After simulation, the initial growth rates of orifice and pore bottom were calculated (D1 and D3, D2 and D4 were set as equal values by the model), and the relationship between different initial depths of pores and initial growth rates was obtained, as shown in Figure 7.
Figure 7.
The growth rate at the top and bottom of the hole varies in terms of the initial conditions of the hole depth. The blue curve D1 is the initial growth rate at the top of the hole, and the red curve D2 is the initial growth rate at the bottom. Analyze: according to the simulation results, when the hole radius is unchanged and the depth reaches a certain limit (depth-width ratio AR≈37.5), the initial growth rate begins to decline; Further discussion shows that the larger the orifice radius is, the deeper the phenomenon begins.
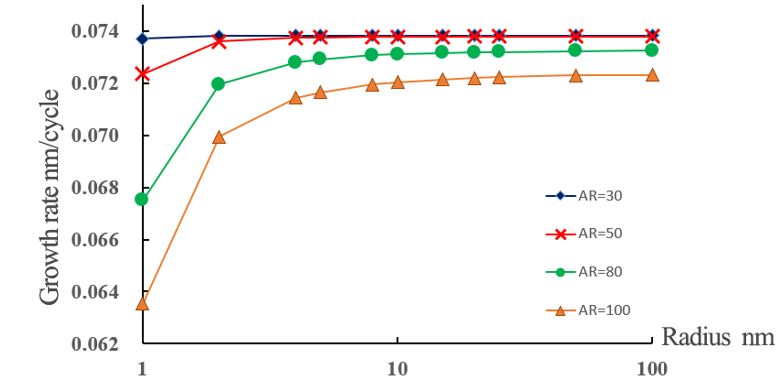
Condition 2: the ratio of depth to width (AR) is 30, 50, 80 and 100, and the radius of orifice is proportional to the depth of hole. The trend of the initial growth rate at the bottom of the hole (D2) was calculated after simulation, as shown in Figure 8.
Figure 8.
The trend of the initial growth rate at the bottom of the hole in terms of the radius of the hole with different aspect ratio. Analyze: according to the simulation results, when the depth-width ratio of the hole is greater than 30 and remains unchanged, the initial growth rate at the bottom of the hole has an obvious downward trend with the equal proportion of radius and depth decreasing, while when the radius and depth are larger, the growth rate tends to be stable. When the depth-width ratio of the hole is less than 30 and remains unchanged, the initial growth rate at the bottom of the hole has little relationship with the radius and depth size and all remain close to the plane growth rate.
4.2.2. Combined Effects of Pressure and Inlet Time on Growth Rate
The product of pressure and entry time is defined as dose δ, where δ =P·T
[12]. If the ALD film has high homogeneity in the pass structure, the input dose shall not be less than the total dose that can fill the reaction site value on the side wall surface of the pore and the reaction site value on the bottom surface. Because the actual process pressure is determined by the atomic layer deposition instrument power and cannot be changed at will, this paper only simulates different entry times.
Condition: vertical pore with depth of 8000nm and radius of 100nm (AR=40), the entry time t was set at 0.7s, 0.4s and 0.1s, respectively, and 800 cycles were deposited. The simulation results are shown in Figure 9.
Figure 9.
The influence of different process time on the sedimentary profile of lateral wall of pore. Analyze: when the pressure is constant, the entry time has a great influence on the sedimentary profile of the lateral wall. The less the entry time is, the smaller the dose can cover the inner surface of the hole. Therefore, the deeper the film goes into the bottom, the less the film thickness will be and the worse the uniformity will be. In the end, "poor deposition" will be formed, affecting the overall shape preservation.
4.2.3. Effects of Sidewall Inclination Angle on Growth Parameters
Since the algorithm of pore with dip angle adopts the CF parameter correction scheme, this paper only conducts simulation research on CF parameters with different dip angles of the pore.
Condition: the hole bottom radius=100nm and depth L=200nm remain unchanged, the dip Angle is 0°, 3°, 5°, 10° and 15°, and the deposition cycles are 200. After the simulation, the background CF parameters are extracted, and the corresponding relationship between CF and parameters is analyzed, as shown in Figure 10, and the simulation results are shown in Figure 11.
Figure 10.
The flux distribution variation in terms of depth in pore structure with different dip Angle Figure 11.
Profile simulation results of pore structure with different inclination angle while the hole bottom size remains unchanged. Analyze: according to the simulation results. Even if the CF parameter is less than 1, the thin film can still be uniformly deposited. The real reason for affecting the growth rate is the ratio of the product of the flux J and the entry time t in Equation (4) to the maximum reaction site [S], which is related to the saturation entry time. With the same size at the bottom of the hole, the flux distribution at the bottom of the hole will increase with the increase of the dip angle. The reason may be that the greater the side dip Angle is, the more likely the by-products of deposition reaction will be discharged, resulting in the increase of the flux concentration that can enter the bottom of the hole, which is consistent with the actual situation.
4.2.4.
SAXP Process Profile Simulation
SAXP is an important process step of graphics transfer technology, which can be divided into SADP (self-aligned double patterning), SAQP (self-aligned quadruple patterning), etc
[15,16]. This model can simulate ALD deposition steps according to SADP principle.
In principle, the size of the side wall as the axis should be equal to 1/3 of the radius of the hole. In this way, after subsequent etching and other processes, the figure of equal width (wall: hole =1:1) can be obtained. Therefore, the simulation conditions were set as hole radius R=60nm and depth L=60nm. The axial width is 20nm; The number of cycles is 270 (the expected growth thickness is 20nm), and the simulation results are shown in Figure 12.
Figure 12.
Profile simulation of the atomic layer deposition step in SADP technology. The simulation result of film thickness is about 19.85nm, which has little error with the actual. In order to study the thin film morphology under the limit conditions, the manufacturer has actually verified the deposition contour when the cycle times are so large that the pores are almost completely covered. In this paper, the deposition contour drawing is given as shown in Figure 13(a). This model simulates the above limit conditions, and the number of cycles is changed to 390 after calculation. The simulation results are shown in Figure 13 (b).
Figure 13.
(a) Contour drawing of the actual process under the limit condition of SADP technology cycle. (b) Profile simulation result. The simulation results are satisfactory. Except for the imprecise shape of the bottom edge of the hole, the other contour lines are consistent with the experiment, which verifies the model accuracy again.


